WhenToBird

Birding spot · Fauquier County, Virginia

Birding at Thompson Wildlife Management Area: What You'll See Each Week

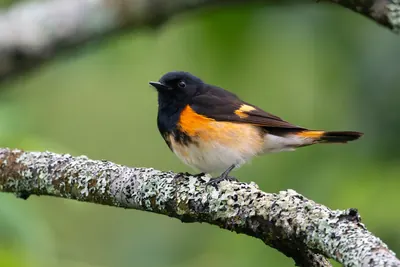
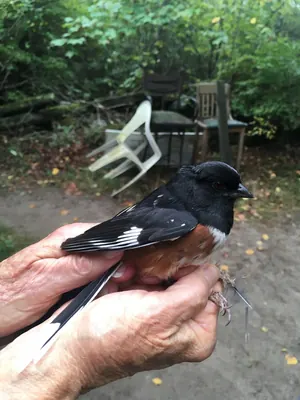
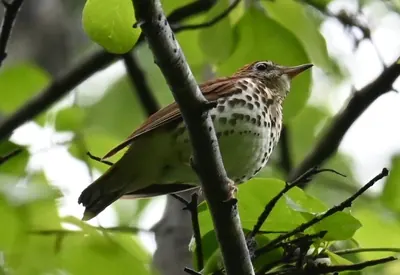
In November, the birds most often reported at Thompson Wildlife Management Area are American Redstart (91%), Eastern Towhee (91%), and Wood Thrush (85%). It is busiest in spring, when 63 species turn up on at least 1 in 20 checklists, and species counts peak in mid May (65 species). 116 species have been reported here across 820 complete checklists from 466 birders.

Species by week

020406080Jan 1-7: low data (0 checklists)Jan 8-14: low data (0 checklists)Jan 15-21: low data (0 checklists)Jan 22-31: low data (0 checklists)Feb 1-7: low data (0 checklists)Feb 8-14: low data (0 checklists)Feb 15-21: low data (0 checklists)Feb 22-28: low data (0 checklists)Mar 1-7: low data (2 checklists)Mar 8-14: low data (0 checklists)Mar 15-21: low data (2 checklists)Mar 22-31: low data (1 checklists)Apr 1-7: low data (4 checklists)Apr 8-14: low data (2 checklists)Apr 15-21: 49 species on 5%+ of 16 checklistsApr 22-30: 59 species on 5%+ of 69 checklistsMay 1-7: 62 species on 5%+ of 156 checklistsMay 8-14: 63 species on 5%+ of 124 checklistsMay 15-21: 65 species on 5%+ of 98 checklistsMay 22-31: 53 species on 5%+ of 106 checklistsJun 1-7: 45 species on 5%+ of 46 checklistsJun 8-14: 50 species on 5%+ of 34 checklistsJun 15-21: 50 species on 5%+ of 35 checklistsJun 22-30: 52 species on 5%+ of 30 checklistsJul 1-7: 47 species on 5%+ of 28 checklistsJul 8-14: 53 species on 5%+ of 20 checklistsJul 15-21: low data (9 checklists)Jul 22-31: low data (9 checklists)Aug 1-7: low data (9 checklists)Aug 8-14: low data (0 checklists)Aug 15-21: low data (1 checklists)Aug 22-31: low data (2 checklists)Sep 1-7: low data (1 checklists)Sep 8-14: low data (2 checklists)Sep 15-21: low data (0 checklists)Sep 22-30: low data (3 checklists)Oct 1-7: low data (5 checklists)Oct 8-14: low data (2 checklists)Oct 15-21: low data (0 checklists)Oct 22-31: low data (2 checklists)Nov 1-7: low data (0 checklists)Nov 8-14: low data (0 checklists)Nov 15-21: low data (0 checklists)Nov 22-30: low data (1 checklists)Dec 1-7: low data (0 checklists)Dec 8-14: low data (0 checklists)Dec 15-21: low data (1 checklists)Dec 22-31: low data (0 checklists)JanFebMarAprMayJunJulAugSepOctNovDec
Number of species reported on at least 5% of complete checklists, by week (4 per month). Grey bars: fewer than 10 checklists, not counted.

In November: what to expect

  1. 1American Redstart91%
  2. 2Eastern Towhee91%
  3. 3Wood Thrush85%
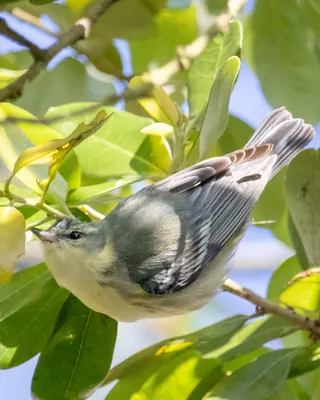
  4. 4Cerulean Warbler84%
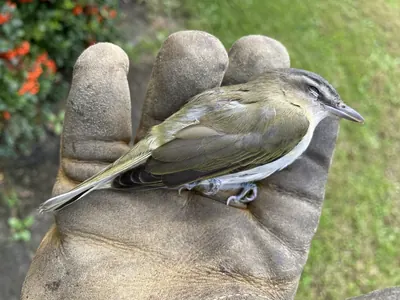
  5. 5Red-eyed Vireo84%
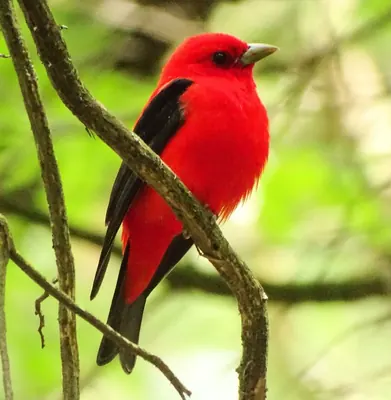
  6. 6Scarlet Tanager78%
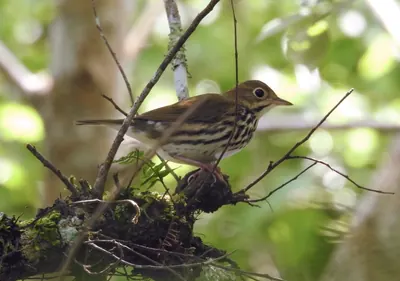
  7. 7Ovenbird78%
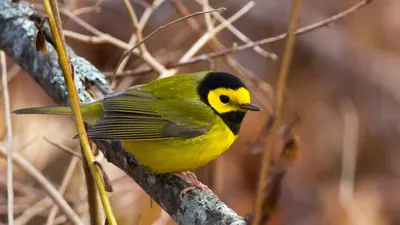
  8. 8Hooded Warbler78%
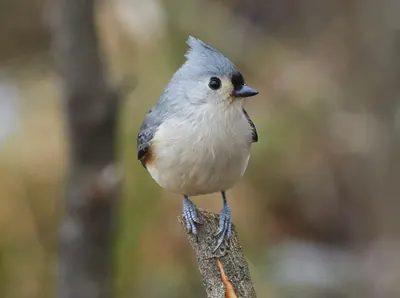
  9. 9Tufted Titmouse74%
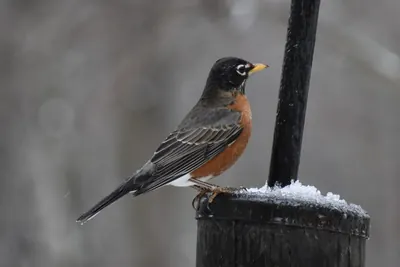
  10. 10American Robin73%
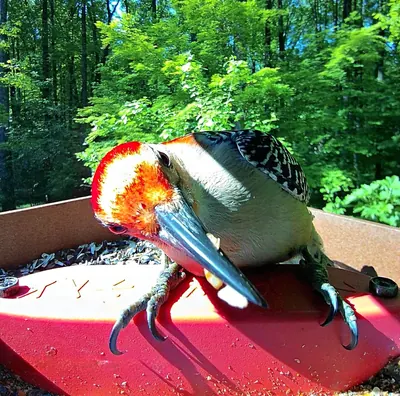
  11. 11Red-bellied Woodpecker68%
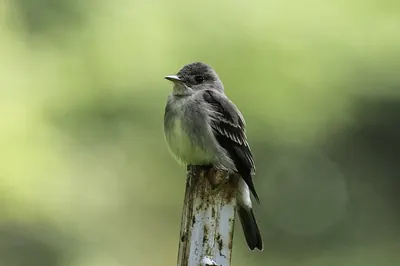
  12. 12Eastern Wood-Pewee65%
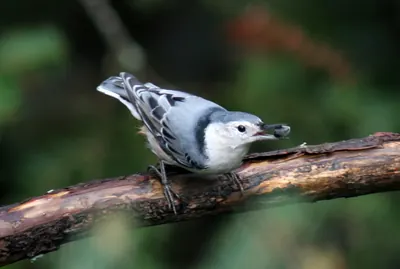
  13. 13White-breasted Nuthatch64%
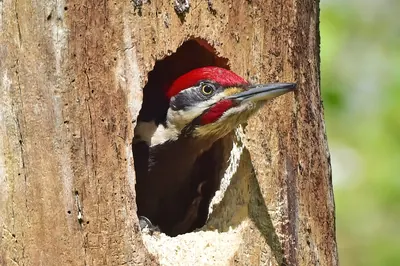
  14. 14Pileated Woodpecker63%
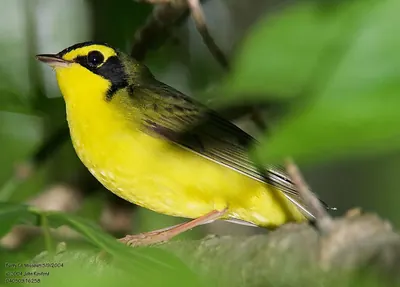
  15. 15Kentucky Warbler63%

Share of complete checklists at this spot that reported the bird in November. The sparkline is the whole year, with this month highlighted.

Season by season

Winter 0 species

    Spring 63 species

    1. American Redstart93%
    2. Eastern Towhee91%
    3. Cerulean Warbler86%
    4. Wood Thrush85%
    5. Ovenbird82%

    Summer 48 species

    1. American Redstart94%
    2. Eastern Towhee94%
    3. Red-eyed Vireo93%
    4. Wood Thrush92%
    5. Eastern Wood-Pewee88%

    Fall 0 species

      Specialties

      Birds reported far more often here than across Virginia.

      Nearby spots

      Frequency is the share of complete checklists at this location that listed the bird, 2016–2025. Busy places report more of everything, and the weekly chart counts species on at least 5% of checklists so a few stray reports do not inflate it. How to read it.