Birding spot · King County, Washington
Birding at Union Bay Natural Area: What You'll See Each Week In November, the birds most often reported at Union Bay Natural Area are Mallard (93%), American Crow (91%), and Gadwall (89%). It is busiest in fall, when 76 species turn up on at least 1 in 20 checklists, and species counts peak in early October (75 species). 215 species have been reported here across 20,611 complete checklists from 3,047 birders.
Species by week 0 20 40 60 80 Jan 1-7: 62 species on 5%+ of 495 checklists Jan 8-14: 64 species on 5%+ of 372 checklists Jan 15-21: 61 species on 5%+ of 366 checklists Jan 22-31: 64 species on 5%+ of 477 checklists Feb 1-7: 65 species on 5%+ of 325 checklists Feb 8-14: 63 species on 5%+ of 307 checklists Feb 15-21: 63 species on 5%+ of 371 checklists Feb 22-28: 65 species on 5%+ of 358 checklists Mar 1-7: 67 species on 5%+ of 366 checklists Mar 8-14: 64 species on 5%+ of 344 checklists Mar 15-21: 63 species on 5%+ of 364 checklists Mar 22-31: 61 species on 5%+ of 594 checklists Apr 1-7: 66 species on 5%+ of 435 checklists Apr 8-14: 68 species on 5%+ of 491 checklists Apr 15-21: 67 species on 5%+ of 553 checklists Apr 22-30: 69 species on 5%+ of 724 checklists May 1-7: 70 species on 5%+ of 566 checklists May 8-14: 67 species on 5%+ of 643 checklists May 15-21: 67 species on 5%+ of 540 checklists May 22-31: 67 species on 5%+ of 772 checklists Jun 1-7: 64 species on 5%+ of 591 checklists Jun 8-14: 56 species on 5%+ of 459 checklists Jun 15-21: 57 species on 5%+ of 334 checklists Jun 22-30: 54 species on 5%+ of 415 checklists Jul 1-7: 52 species on 5%+ of 320 checklists Jul 8-14: 51 species on 5%+ of 304 checklists Jul 15-21: 53 species on 5%+ of 300 checklists Jul 22-31: 57 species on 5%+ of 465 checklists Aug 1-7: 56 species on 5%+ of 282 checklists Aug 8-14: 56 species on 5%+ of 290 checklists Aug 15-21: 61 species on 5%+ of 301 checklists Aug 22-31: 63 species on 5%+ of 530 checklists Sep 1-7: 67 species on 5%+ of 400 checklists Sep 8-14: 69 species on 5%+ of 351 checklists Sep 15-21: 70 species on 5%+ of 412 checklists Sep 22-30: 70 species on 5%+ of 594 checklists Oct 1-7: 75 species on 5%+ of 375 checklists Oct 8-14: 67 species on 5%+ of 396 checklists Oct 15-21: 71 species on 5%+ of 380 checklists Oct 22-31: 69 species on 5%+ of 568 checklists Nov 1-7: 72 species on 5%+ of 398 checklists Nov 8-14: 65 species on 5%+ of 417 checklists Nov 15-21: 66 species on 5%+ of 429 checklists Nov 22-30: 66 species on 5%+ of 542 checklists Dec 1-7: 63 species on 5%+ of 295 checklists Dec 8-14: 61 species on 5%+ of 278 checklists Dec 15-21: 64 species on 5%+ of 263 checklists Dec 22-31: 64 species on 5%+ of 459 checklists Jan Feb Mar Apr May Jun Jul Aug Sep Oct Nov Dec Number of species reported on at least 5% of complete checklists, by week (4 per month). Grey bars: fewer than 10 checklists, not counted. In November: what to expect 1 Mallard 93% 2 American Crow 91% 3 Gadwall 89% 4 Northern Shoveler 87% 5 Song Sparrow 85% 6 Bufflehead 84% 7 Black-capped Chickadee 84% 8 Pied-billed Grebe 83% 9 American Coot 83% 10 American Wigeon 82% 11 American Robin 79% 12 Hooded Merganser 79% 13 Great Blue Heron 76% 14 Double-crested Cormorant 73% 15 Canada Goose 72% Share of complete checklists at this spot that reported the bird in November. The sparkline is the whole year, with this month highlighted.
Season by season Specialties Birds reported far more often here than across Washington.
Nearby spots Frequency is the share of complete checklists at this location that listed the bird, 2016–2025. Busy places report more of everything, and the weekly chart counts species on at least 5% of checklists so a few stray reports do not inflate it. How to read it .
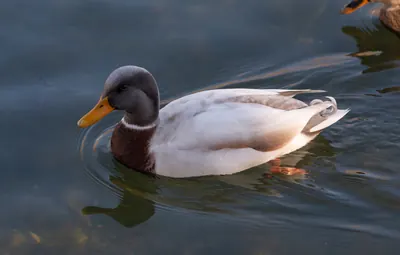 Mallard93%
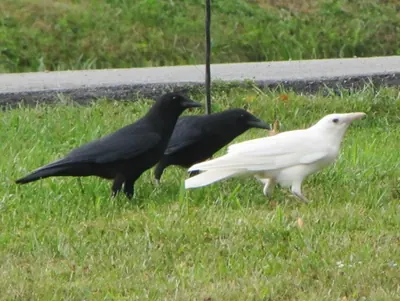 American Crow91%
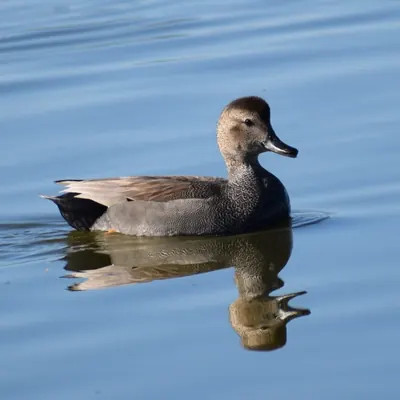 Gadwall89%
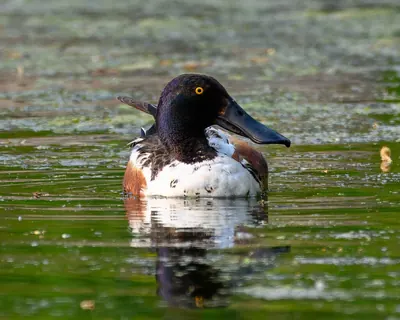 Northern Shoveler87%
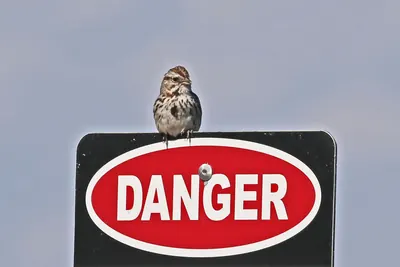 Song Sparrow85%
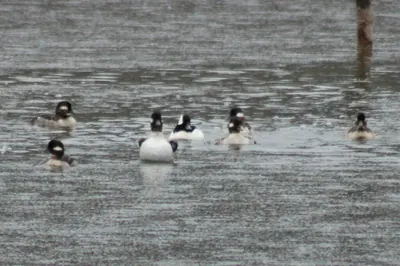 Bufflehead84%
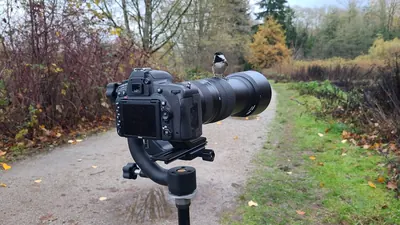 Black-capped Chickadee84%
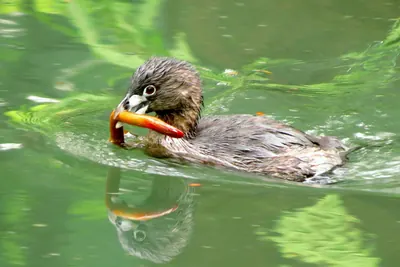 Pied-billed Grebe83%
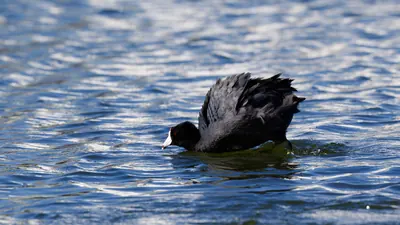 American Coot83%
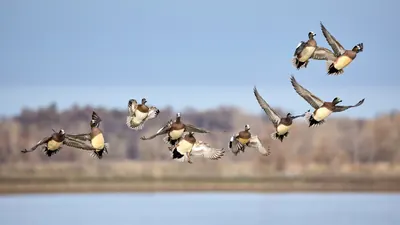 American Wigeon82%
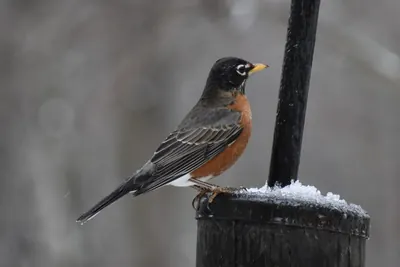 American Robin79%
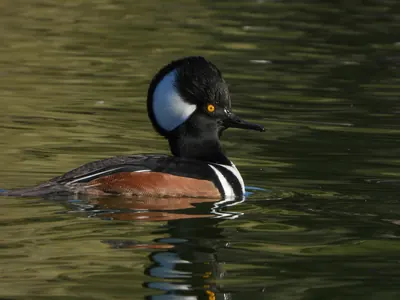 Hooded Merganser79%
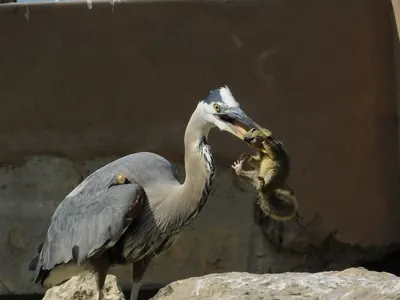 Great Blue Heron76%
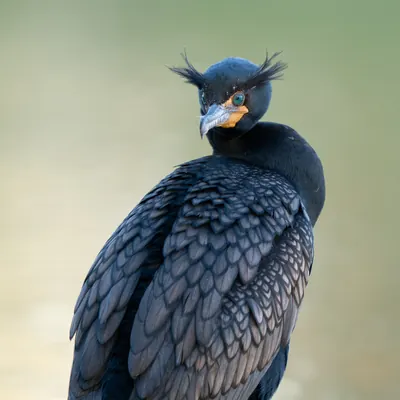 Double-crested Cormorant73%
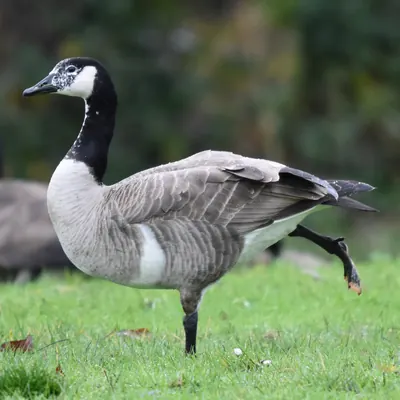 Canada Goose72%