Birding spot · Orange County, California
Birding at Crescent Bay Point Park: What You'll See Each Week
In November, the birds most often reported at Crescent Bay Point Park are Western Gull (91%), Brown Pelican (86%), and Willet (85%). It is busiest in winter, when 42 species turn up on at least 1 in 20 checklists, and species counts peak in early April (60 species). 99 species have been reported here across 852 complete checklists from 355 birders.
Species by week
In November: what to expect
- 1
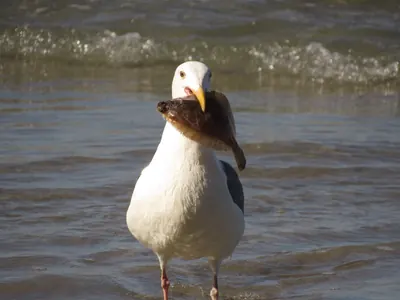 Western Gull91%
- 2
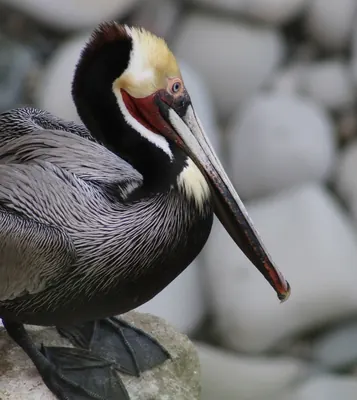 Brown Pelican86%
- 3
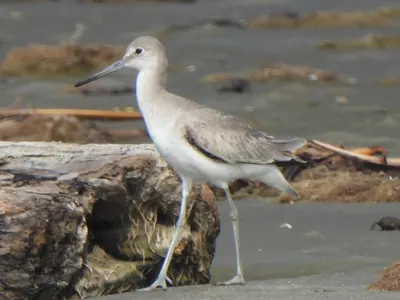 Willet85%
- 4
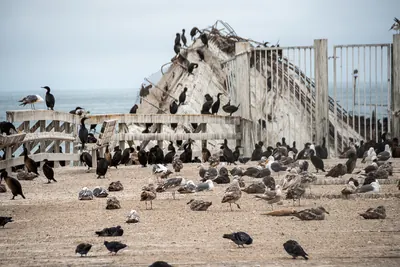 Brandt's Cormorant81%
- 5
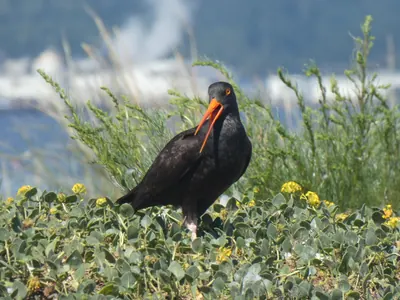 Black Oystercatcher75%
- 6
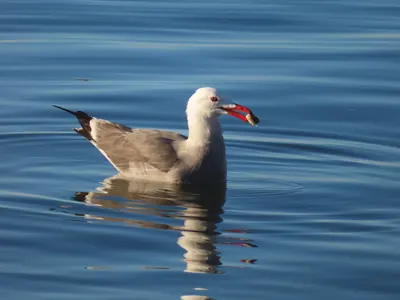 Heermann's Gull74%
- 7
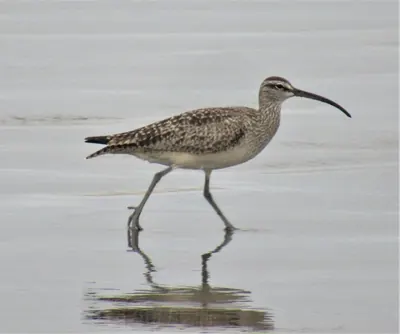 Hudsonian Whimbrel68%
- 8
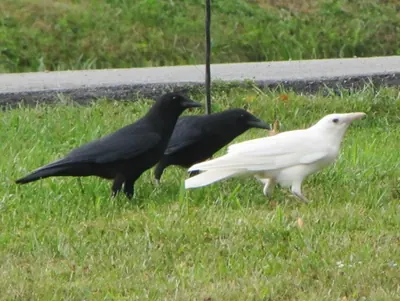 American Crow61%
- 9
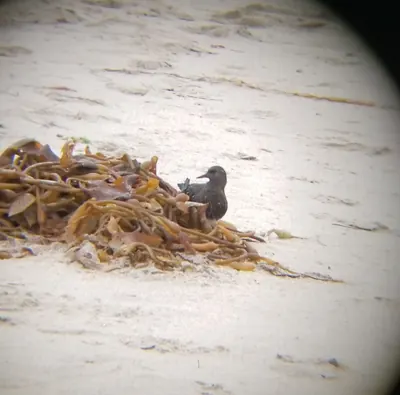 Black Turnstone54%
- 10
 Yellow-rumped Warbler54%
- 11
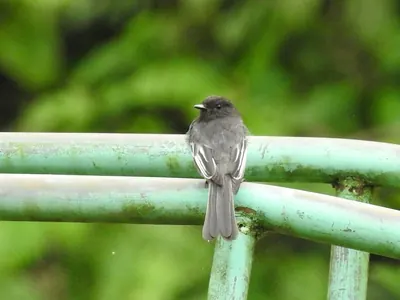 Black Phoebe47%
- 12
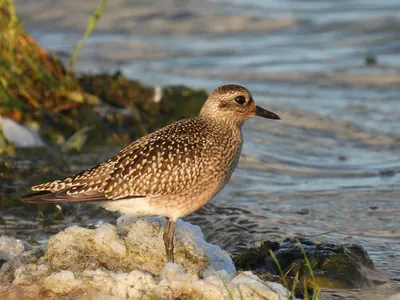 Black-bellied Plover46%
- 13
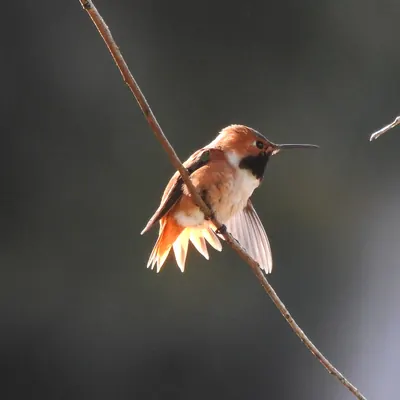 Allen's Hummingbird45%
- 14
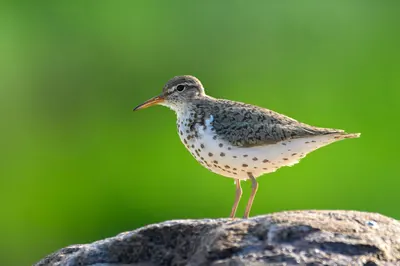 Spotted Sandpiper39%
- 15
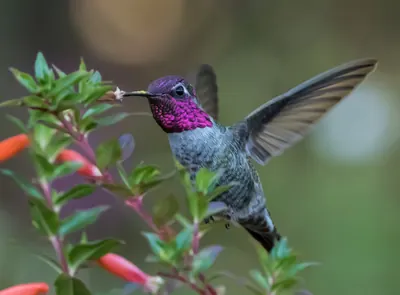 Anna's Hummingbird35%
Share of complete checklists at this spot that reported the bird in November. The sparkline is the whole year, with this month highlighted.
Season by season
Winter 42 species
Spring 42 species
Summer 37 species
Fall 39 species
Specialties
Birds reported far more often here than across California.
- Black-vented Shearwater
- Surfbird
- Black Turnstone
- Black Oystercatcher
- Brandt's Cormorant
- Heermann's Gull
- Hudsonian Whimbrel
- Pelagic Cormorant
Nearby spots
- Crystal Cove (5.7 km)
- Laguna Niguel Regional Park (8.7 km)
- University of California, Irvine Open Space Reserve (11.0 km)
- South-Quail Hill Open Space Preserve (12.0 km)
- William R Mason Regional Park (12.4 km)
- Dana Point Preserve (12.6 km)
Frequency is the share of complete checklists at this location that listed the bird, 2016–2025. Busy places report more of everything, and the weekly chart counts species on at least 5% of checklists so a few stray reports do not inflate it. How to read it.