Birding spot · San Diego County, California
Birding at San Elijo Lagoon Ecological Reserve: What You'll See Each Week In November, the birds most often reported at San Elijo Lagoon Ecological Reserve are Great Egret (82%), Snowy Egret (80%), and Double-crested Cormorant (78%). It is busiest in spring, when 105 species turn up on at least 1 in 20 checklists, and species counts peak in the second week of April (105 species). 224 species have been reported here across 6,462 complete checklists from 2,284 birders.
Species by week 0 25 50 75 100 125 Jan 1-7: 93 species on 5%+ of 205 checklists Jan 8-14: 96 species on 5%+ of 182 checklists Jan 15-21: 93 species on 5%+ of 156 checklists Jan 22-31: 94 species on 5%+ of 202 checklists Feb 1-7: 91 species on 5%+ of 130 checklists Feb 8-14: 103 species on 5%+ of 180 checklists Feb 15-21: 97 species on 5%+ of 191 checklists Feb 22-28: 101 species on 5%+ of 177 checklists Mar 1-7: 94 species on 5%+ of 126 checklists Mar 8-14: 103 species on 5%+ of 136 checklists Mar 15-21: 93 species on 5%+ of 121 checklists Mar 22-31: 99 species on 5%+ of 176 checklists Apr 1-7: 99 species on 5%+ of 108 checklists Apr 8-14: 105 species on 5%+ of 137 checklists Apr 15-21: 100 species on 5%+ of 119 checklists Apr 22-30: 99 species on 5%+ of 157 checklists May 1-7: 83 species on 5%+ of 115 checklists May 8-14: 92 species on 5%+ of 120 checklists May 15-21: 83 species on 5%+ of 91 checklists May 22-31: 83 species on 5%+ of 96 checklists Jun 1-7: 69 species on 5%+ of 72 checklists Jun 8-14: 72 species on 5%+ of 111 checklists Jun 15-21: 70 species on 5%+ of 89 checklists Jun 22-30: 73 species on 5%+ of 85 checklists Jul 1-7: 78 species on 5%+ of 76 checklists Jul 8-14: 78 species on 5%+ of 130 checklists Jul 15-21: 70 species on 5%+ of 109 checklists Jul 22-31: 68 species on 5%+ of 138 checklists Aug 1-7: 73 species on 5%+ of 123 checklists Aug 8-14: 78 species on 5%+ of 119 checklists Aug 15-21: 69 species on 5%+ of 125 checklists Aug 22-31: 72 species on 5%+ of 153 checklists Sep 1-7: 78 species on 5%+ of 140 checklists Sep 8-14: 79 species on 5%+ of 131 checklists Sep 15-21: 85 species on 5%+ of 79 checklists Sep 22-30: 81 species on 5%+ of 121 checklists Oct 1-7: 82 species on 5%+ of 104 checklists Oct 8-14: 87 species on 5%+ of 142 checklists Oct 15-21: 85 species on 5%+ of 130 checklists Oct 22-31: 93 species on 5%+ of 139 checklists Nov 1-7: 88 species on 5%+ of 102 checklists Nov 8-14: 96 species on 5%+ of 147 checklists Nov 15-21: 93 species on 5%+ of 111 checklists Nov 22-30: 95 species on 5%+ of 207 checklists Dec 1-7: 100 species on 5%+ of 113 checklists Dec 8-14: 97 species on 5%+ of 126 checklists Dec 15-21: 98 species on 5%+ of 126 checklists Dec 22-31: 95 species on 5%+ of 289 checklists Jan Feb Mar Apr May Jun Jul Aug Sep Oct Nov Dec Number of species reported on at least 5% of complete checklists, by week (4 per month). Grey bars: fewer than 10 checklists, not counted. In November: what to expect 1 Great Egret 82% 2 Snowy Egret 80% 3 Double-crested Cormorant 78% 4 Mallard 78% 5 Black Phoebe 76% 6 Yellow-rumped Warbler 73% 7 Great Blue Heron 71% 8 Osprey 71% 9 House Finch 68% 10 White-crowned Sparrow 66% 11 Pied-billed Grebe 65% 12 Anna's Hummingbird 65% 13 Song Sparrow 64% 14 Common Yellowthroat 63% 15 Belted Kingfisher 61% Share of complete checklists at this spot that reported the bird in November. The sparkline is the whole year, with this month highlighted.
Season by season Specialties Birds reported far more often here than across California.
Ridgway's Rail27% of checklists here vs 0.6% statewide: 44.5× California Gnatcatcher14% of checklists here vs 0.8% statewide: 19.1× Yellow-crowned Night Heron 8.9% of checklists here vs 0.5% statewide: 16.2× Least Tern 6.4% of checklists here vs 0.6% statewide: 10.6× Semipalmated Plover 21% of checklists here vs 2.1% statewide: 10.0× Osprey 50% of checklists here vs 5.5% statewide: 9.1× Blue-winged Teal 14% of checklists here vs 1.6% statewide: 8.6× Northern Pintail 26% of checklists here vs 3.1% statewide: 8.5× Nearby spots Frequency is the share of complete checklists at this location that listed the bird, 2016–2025. Busy places report more of everything, and the weekly chart counts species on at least 5% of checklists so a few stray reports do not inflate it. How to read it .
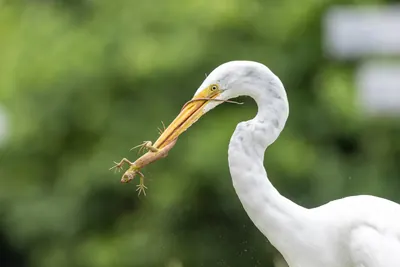 Great Egret82%
 Snowy Egret80%
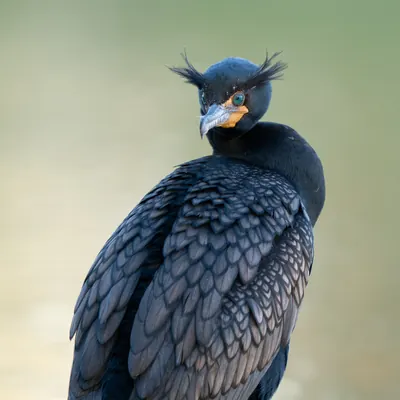 Double-crested Cormorant78%
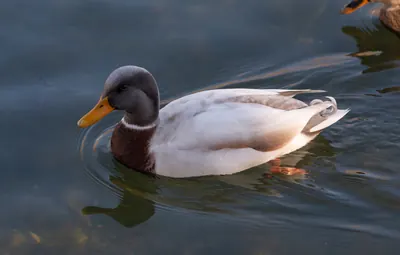 Mallard78%
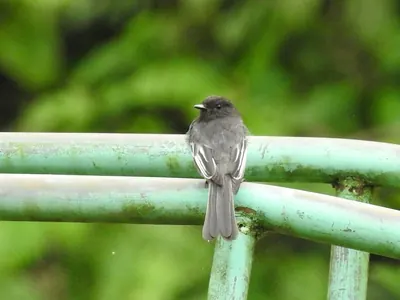 Black Phoebe76%
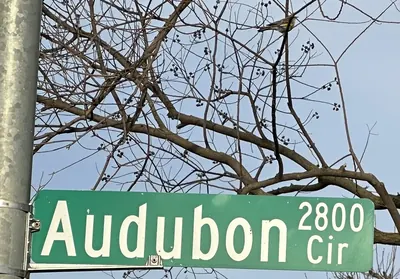 Yellow-rumped Warbler73%
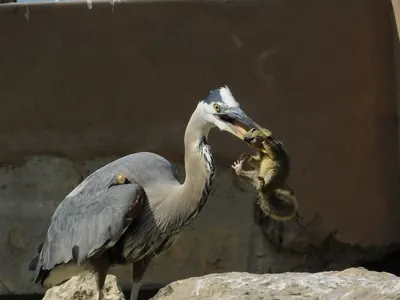 Great Blue Heron71%
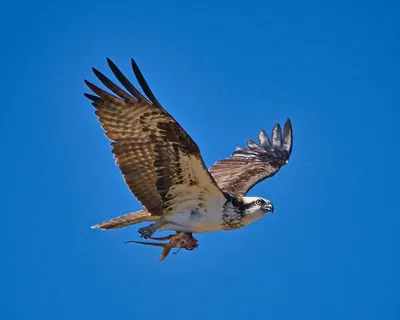 Osprey71%
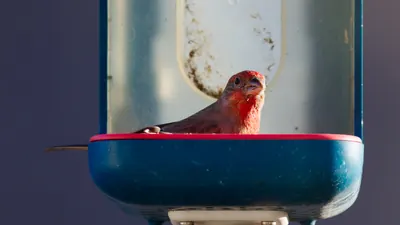 House Finch68%
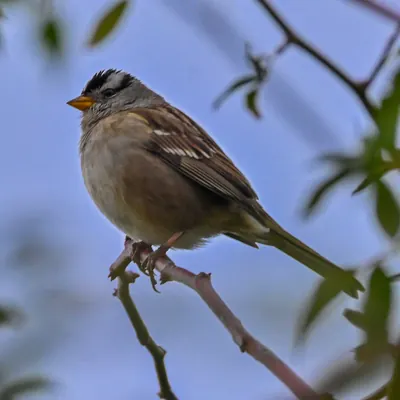 White-crowned Sparrow66%
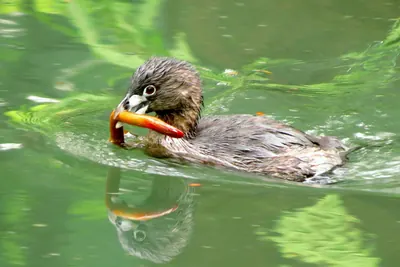 Pied-billed Grebe65%
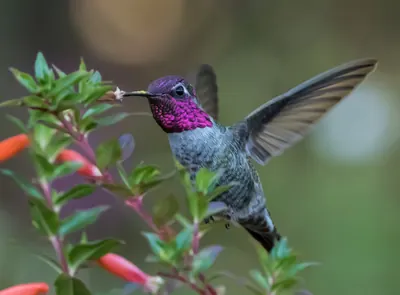 Anna's Hummingbird65%
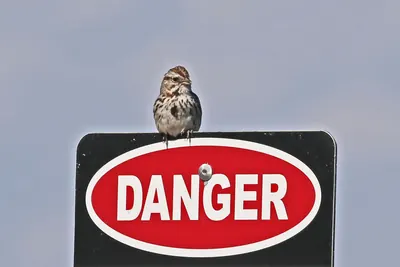 Song Sparrow64%
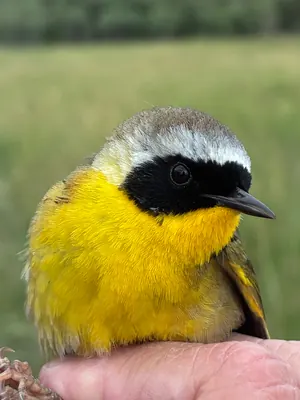 Common Yellowthroat63%
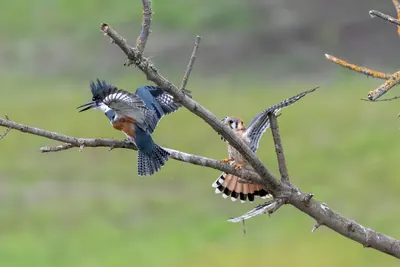 Belted Kingfisher61%