Birding spot · Charlotte County, Florida
Birding at Ollie's Pond Park: What You'll See Each Week
In November, the birds most often reported at Ollie's Pond Park are Common Gallinule (98%), Black-bellied Whistling-Duck (89%), and Blue-gray Gnatcatcher (82%). It is busiest in spring, when 71 species turn up on at least 1 in 20 checklists, and species counts peak in early May (74 species). 171 species have been reported here across 2,125 complete checklists from 549 birders.
Species by week
In November: what to expect
- 1
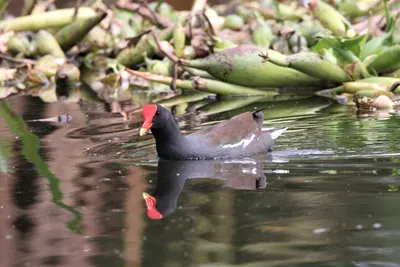 Common Gallinule98%
- 2
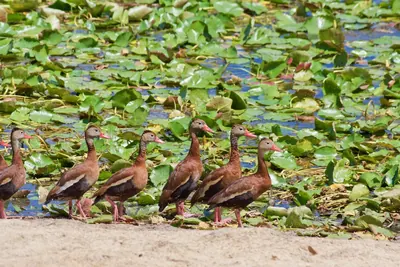 Black-bellied Whistling-Duck89%
- 3
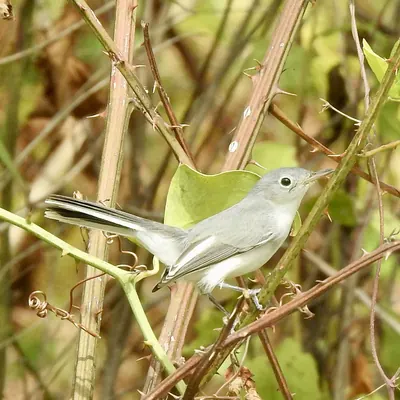 Blue-gray Gnatcatcher82%
- 4
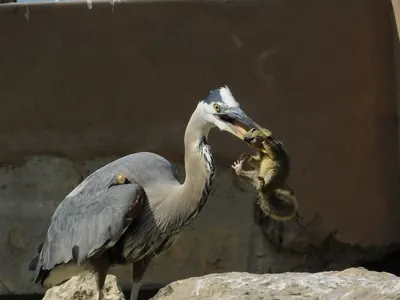 Great Blue Heron81%
- 5
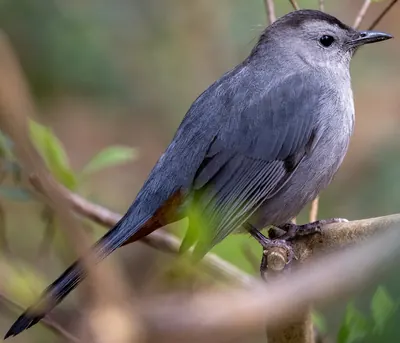 Gray Catbird80%
- 6
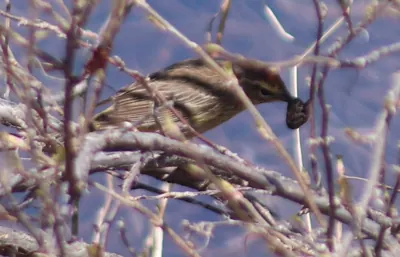 Palm Warbler78%
- 7
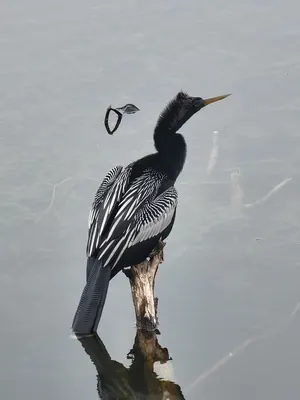 Anhinga73%
- 8
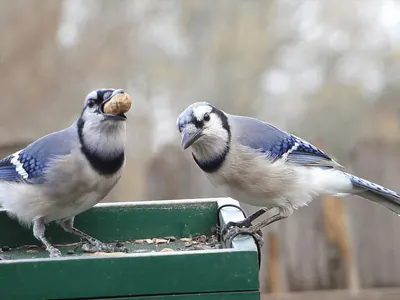 Blue Jay73%
- 9
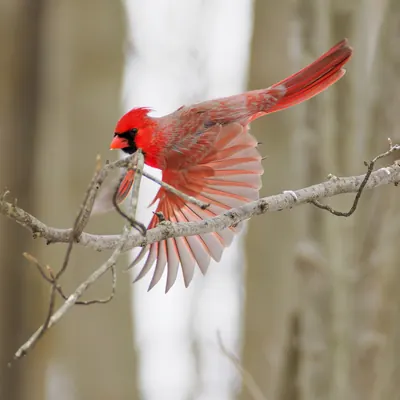 Northern Cardinal68%
- 10
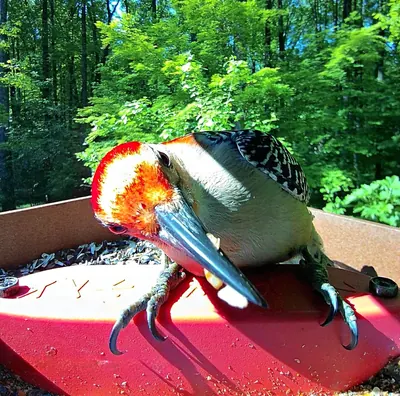 Red-bellied Woodpecker67%
- 11
 Yellow-rumped Warbler67%
- 12
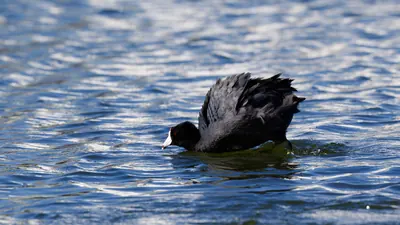 American Coot66%
- 13
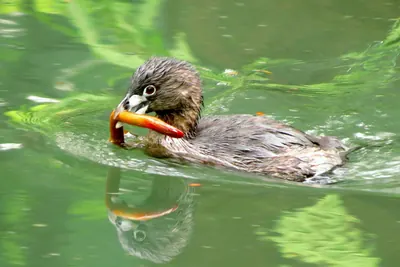 Pied-billed Grebe66%
- 14
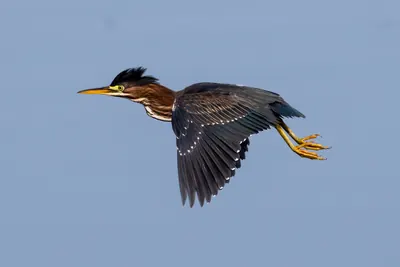 Green Heron66%
- 15
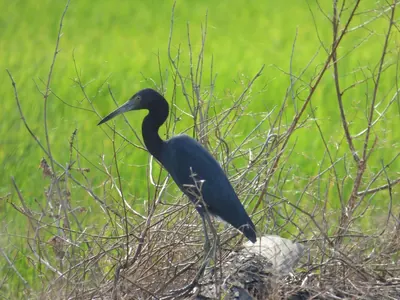 Little Blue Heron65%
Share of complete checklists at this spot that reported the bird in November. The sparkline is the whole year, with this month highlighted.
Season by season
Winter 64 species
Spring 71 species
Summer 47 species
Fall 65 species
Specialties
Birds reported far more often here than across Florida.
- Cinnamon Teal
- Ring-necked Duck
- Solitary Sandpiper
- Black-necked Stilt
- Black-bellied Whistling-Duck
- Semipalmated Sandpiper
- Purple Gallinule
- Blue-winged Teal
Nearby spots
- Kiwanis Park (1.6 km)
- Lemon Lake (19.2 km)
- Cedar Point Environmental Park (19.6 km)
- Stump Pass Beach State Park (21.6 km)
- Lemon Bay Park and Environmental Center (22.3 km)
- Manasota Scrub Preserve (24.5 km)
Frequency is the share of complete checklists at this location that listed the bird, 2016–2025. Busy places report more of everything, and the weekly chart counts species on at least 5% of checklists so a few stray reports do not inflate it. How to read it.