WhenToBird

Charadrius melodus · Charadriidae

When Do Piping Plovers Arrive in North Carolina?

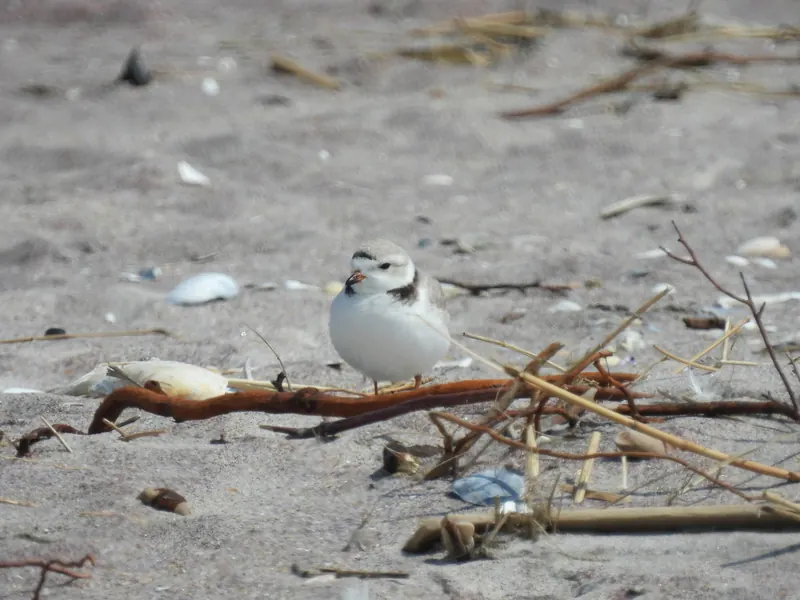
Adult Piping Plover
Photo: Caroline Quinn, CC BY 4.0 via iNaturalist

Piping Plovers arrive in North Carolina in early March, peak in the second week of August (1.2% of checklists), and most are gone by mid November.

When to look

First arrivalsMar 1-7early March
Common byMar 1-7early March
PeakAug 8-14the second week of August
Most gone byNov 15-21mid November

Best: the second week of August. First arrivals early March; most are gone by mid November. Peak: on about 1.2% of North Carolina checklists.

  1. Janrare
  2. Febrare
  3. Maruncommon
  4. Apruncommon
  5. Mayuncommon
  6. Jununcommon
  7. Julcommon
  8. Augpeak season
  9. Sepcommon
  10. Octuncommon
  11. Novuncommon
  12. Decrare

Darker months: more checklists report it. Outlined: peak month.

0%0.5%1%1.5%Jan 1-7: 0.1% of 30085 checklistsJan 8-14: 0.2% of 22728 checklistsJan 15-21: 0.2% of 24292 checklistsJan 22-31: 0.1% of 34122 checklistsFeb 1-7: 0.1% of 26352 checklistsFeb 8-14: 0.1% of 29663 checklistsFeb 15-21: 0.1% of 41515 checklistsFeb 22-28: 0.1% of 24318 checklistsMar 1-7: 0.2% of 23408 checklistsMar 8-14: 0.3% of 22658 checklistsMar 15-21: 0.3% of 22784 checklistsMar 22-31: 0.5% of 36034 checklistsApr 1-7: 0.3% of 28131 checklistsApr 8-14: 0.3% of 29190 checklistsApr 15-21: 0.2% of 32847 checklistsApr 22-30: 0.3% of 47966 checklistsMay 1-7: 0.2% of 37076 checklistsMay 8-14: 0.4% of 36228 checklistsMay 15-21: 0.4% of 30378 checklistsMay 22-31: 0.5% of 40237 checklistsJun 1-7: 0.3% of 27551 checklistsJun 8-14: 0.2% of 26473 checklistsJun 15-21: 0.3% of 22789 checklistsJun 22-30: 0.2% of 27615 checklistsJul 1-7: 0.3% of 20022 checklistsJul 8-14: 0.3% of 19315 checklistsJul 15-21: 0.5% of 18934 checklistsJul 22-31: 0.9% of 25600 checklistsAug 1-7: 1.2% of 17987 checklistsAug 8-14: 1.4% of 17307 checklistsAug 15-21: 1.1% of 17080 checklistsAug 22-31: 1.0% of 25844 checklistsSep 1-7: 0.6% of 20818 checklistsSep 8-14: 0.5% of 20070 checklistsSep 15-21: 0.4% of 21984 checklistsSep 22-30: 0.5% of 26979 checklistsOct 1-7: 0.4% of 22605 checklistsOct 8-14: 0.4% of 22677 checklistsOct 15-21: 0.6% of 21407 checklistsOct 22-31: 0.3% of 25927 checklistsNov 1-7: 0.2% of 18830 checklistsNov 8-14: 0.3% of 18418 checklistsNov 15-21: 0.3% of 19101 checklistsNov 22-30: 0.2% of 25709 checklistsDec 1-7: 0.1% of 18856 checklistsDec 8-14: 0.1% of 18745 checklistsDec 15-21: 0.1% of 22478 checklistsDec 22-31: 0.1% of 34796 checklistsJanFebMarAprMayJunJulAugSepOctNovDec
Share of complete checklists reporting it, by week (4 per month). Grey bars: fewer than 10 checklists, not counted.

Frequency is the share of complete checklists in North Carolina that listed the bird, 2016–2025. It is not a head count, and it follows where and when people go birding. How to read it.

JanFebMarAprMayJunJulAugSepOctNovDec
today
Second week of November

Each county is shaded by the share of complete checklists there that listed the bird, blended with the weeks either side. Darker is more often. It follows where people watch birds, not how many birds there are. How to read it.

Embed this map on your site

Where in North Carolina

Best counties

Share of checklists at the peak
  1. Onslow CountyBest the second week of August · 137 checklists that week, 8,231 in all16%
  2. Dare CountyBest early August · 1487 checklists that week, 83,121 in all7.7%
  3. Hyde CountyBest mid September · 89 checklists that week, 8,350 in all7.0%
  4. Pender CountyBest early October · 167 checklists that week, 6,911 in all6.1%
  5. New Hanover CountyBest the second week of August · 404 checklists that week, 33,362 in all6.1%
  6. Carteret CountyBest mid August · 528 checklists that week, 27,746 in all4.8%

Best spots

Share of checklists at the peak
  1. New River InletOnslow County, best the second week of August · 25 checklists that week, 594 in all68%
  2. Pea Island National Wildlife Refuge (South Point)Dare County, best late September · 23 checklists that week, 1,223 in all57%
  3. Cape Hatteras National SeashoreDare County, best late July · 65 checklists that week, 1,306 in all55%
  4. Cape HatterasDare County, best the second week of August · 30 checklists that week, 1,295 in all47%
  5. Pea Island National Wildlife Refuge (northwest)Dare County, best late July · 38 checklists that week, 1,318 in all44%
  6. Mason InletNew Hanover County, best the second week of August · 40 checklists that week, 1,938 in all43%

Busy spots report more of everything; compare the checklist counts before you drive anywhere.

Best time of day

In North Carolina, the Piping Plover is most often listed on checklists started between 6 and 8 am (0.5% of those checklists).

0%0.5%1%12 am: too few checklists (520) to judge1 am: too few checklists (489) to judge2 am: too few checklists (442) to judge3 am: too few checklists (544) to judge4 am: too few checklists (1621) to judge5 am: too few checklists (9671) to judge6 am: 0.9% of 50335 checklists7 am: 0.4% of 150152 checklists8 am: 0.3% of 182902 checklists9 am: 0.3% of 158933 checklists10 am: 0.3% of 128398 checklists11 am: 0.3% of 98671 checklists12 pm: 0.3% of 78640 checklists1 pm: 0.3% of 72510 checklists2 pm: 0.3% of 69179 checklists3 pm: 0.3% of 67669 checklists4 pm: 0.3% of 63964 checklists5 pm: 0.4% of 48520 checklists6 pm: 0.5% of 33196 checklists7 pm: too few checklists (19700) to judge8 pm: too few checklists (6160) to judge9 pm: too few checklists (1943) to judge10 pm: too few checklists (1119) to judge11 pm: too few checklists (651) to judge12a3a6a9a12p3p6p9p
Share of checklists started in each local hour that reported it. It reflects when people go birding as well as when birds are active. Grey hours have too few checklists (under 2% of the state’s, or under 200) to judge.
Week-by-week table
MonthDays 1-78-1415-2122-end
January0.1%0.2%0.2%0.1%
February0.1%0.1%0.1%0.1%
March0.2%0.3%0.3%0.5%
April0.3%0.3%0.2%0.3%
May0.2%0.4%0.4%0.5%
June0.3%0.2%0.3%0.2%
July0.3%0.3%0.5%0.9%
August1.2%1.4%1.1%1.0%
September0.6%0.5%0.4%0.5%
October0.4%0.4%0.6%0.3%
November0.2%0.3%0.3%0.2%
December0.1%0.1%0.1%0.1%

Neighboring states

  • South Carolina: arrives late July, 19 weeks later than North Carolina
  • Delaware: arrives mid March, 2 weeks later than North Carolina
  • New Jersey: arrives mid March, 2 weeks later than North Carolina
  • Alabama: arrives mid July, 18 weeks later than North Carolina

Common questions

When do Piping Plovers arrive in North Carolina?
Piping Plovers arrive in North Carolina in early March, peak in the second week of August (1.2% of checklists), and most are gone by mid November.
When do Piping Plovers leave North Carolina?
Most Piping Plovers have left North Carolina by mid November, when reports fall below half their usual rate.
When is the best time to see a Piping Plover in North Carolina?
The Piping Plover is reported most often in the second week of August, on about 1.2% of North Carolina checklists.
Where in North Carolina are Piping Plovers seen most often?
By county, Onslow County, Dare County, and Hyde County have the highest peak reporting rates for the Piping Plover (counties with at least 200 checklists).